Applications
The MED64 System enables you to acquire electrical activity induced by excitable cells such as neural, cardiac, or skeletal muscular cells or tissue, as extracellular potential. So far it has been used for studies published in more than 450 papers. Along with the spread of MEA into the fields of cell biology and pharmacology, the number of applications in iPSc-derived cardiomyocytes and neurons has also risen recently, in addition to traditional ones in brain slices.
Acute Brain Slice # 1 - Evoked Potential
The most popular application of the MED64 System is measuring evoked potentials (EPs) in acute brain slices. The MED64 System has extensive experience with long-term potentiation (LTP) assays, especially in the hippocampus and cerebral cortex. LTP is a phenomenon where the amplitude of potentials evoked by a stimulus at intervals of tens of seconds at a constant intensity is continuously enhanced after a specific stimulation, known as a “tetanus” or “theta burst,” is delivered.
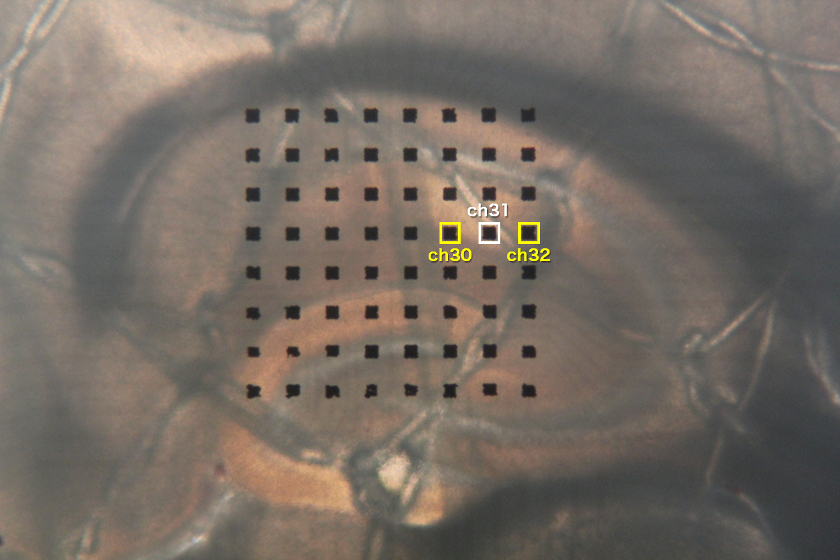
- A mouse hippocampal slice on a MED probe (MED-P515A). By stimulating Schaffer collaterals projecting from the CA3 region to the CA1 region, we acquire EPs derived from synaptic responses formed by them and pyramidal dendrites in the stratum radiatum. In this example, we stimulate the Schaffer collaterals passing through ch30 and ch32 alternately every 20 seconds and focus on the EPs on ch31. Note that the EPs at ch31 from stimulating ch30 or ch32 differ qualitatively from each other because the excited synapses that arise from stimulating ch30 or ch32 are different.
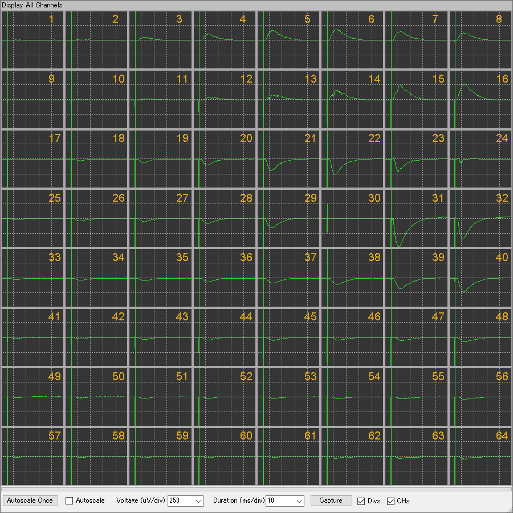
- Owing to the orderly organization of the hippocampus, we can see the upward waveforms from the ascending layer to the pyramidal layer (ch1-16), and downward waveforms from the radiate layer to the molecular layer (ch17-32).
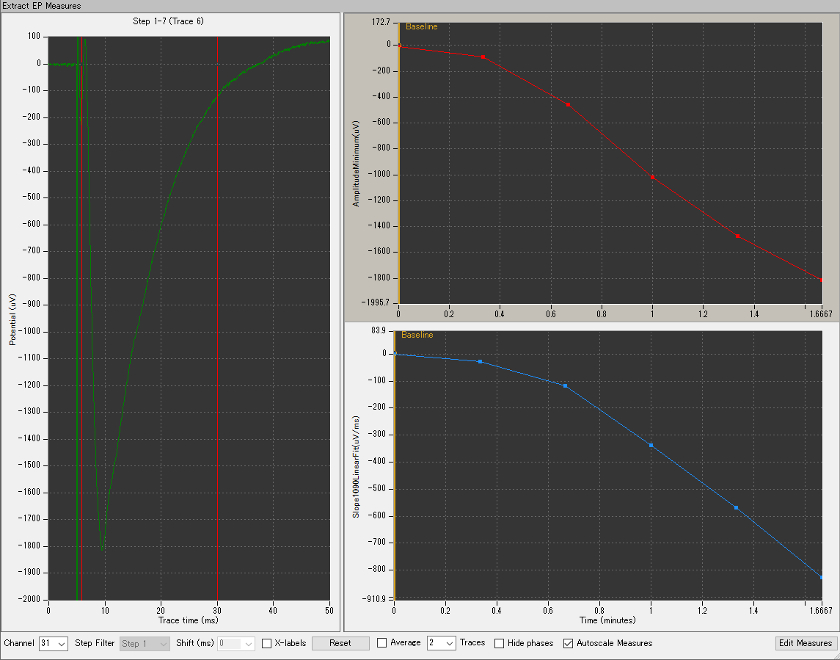
- Measurement of the IO curve. The magnitude of the EP is quantified by the falling slope and peak amplitude of the downward waveform, which depend on the degree of adhesion between the slice and the electrode. That means those absolute values vary artificially from one sample to another. As such, the percentage change in the baseline responses is commonly used because it is not appropriate to treat the values as those for statistical analysis.
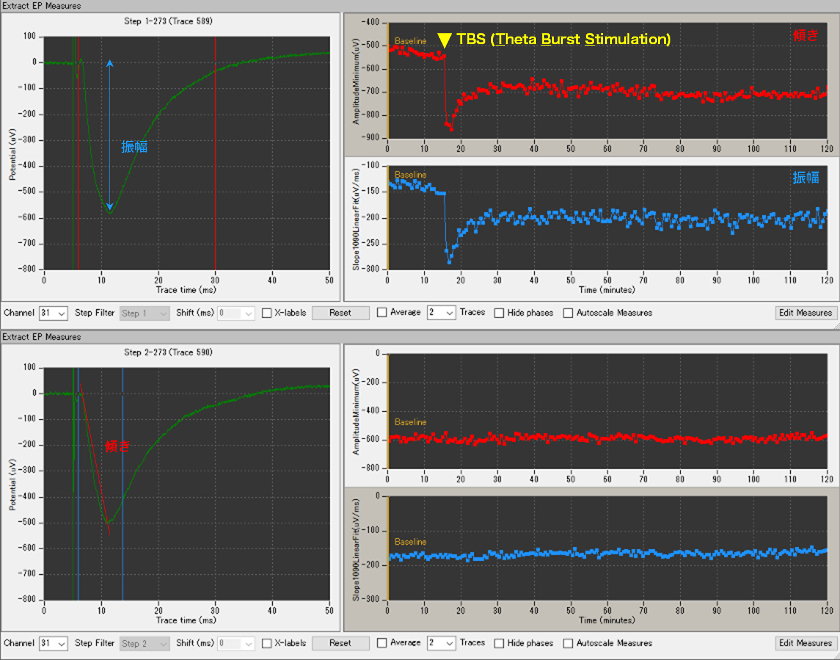
- The upper half of the figure shows the EPs at ch31 from stimulating ch30, and the lower half displays the EPs at ch31 from stimulating ch32. A test stimulus was applied at ch30 for 15 min, followed by a 2-sec theta burst stimulation. The EP magnitude subsequent to the test stimulus was enhanced and maintained for about 2 hrs.
- Data provided by
Alpha MED Scientific, Inc.
Acute Brain Slice # 2 - Oscillation
The second common application in acute brain slices is the study of oscillation. Oscillation is a local field potential (LFP) generated by the synchronous activity of neural networks in various cycles. It can be induced through drug administration by perfusion or electrical stimulation, and is applied to neurophysiological studies of its circuit mechanism, as well as pharmacological and pathophysiological studies of phenomena such as learning, memory, and epilepsy.
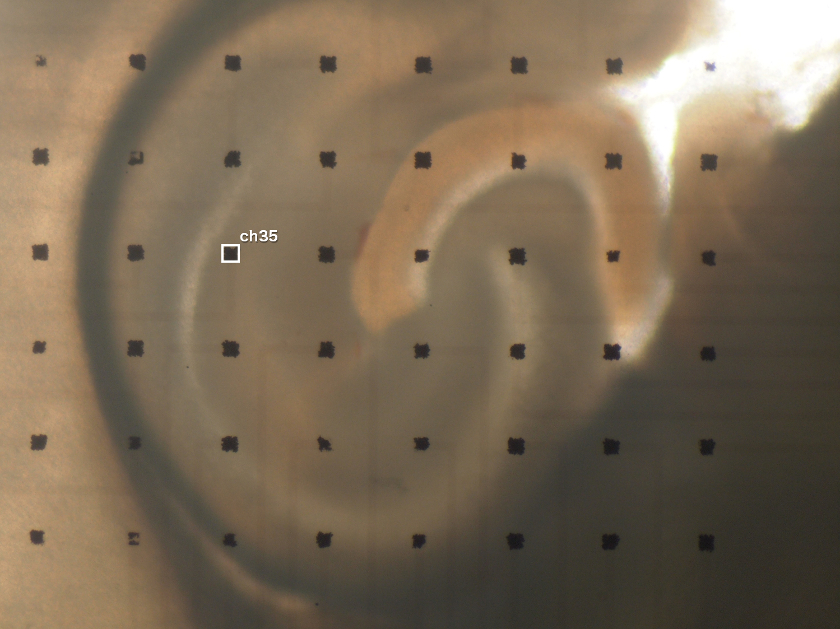
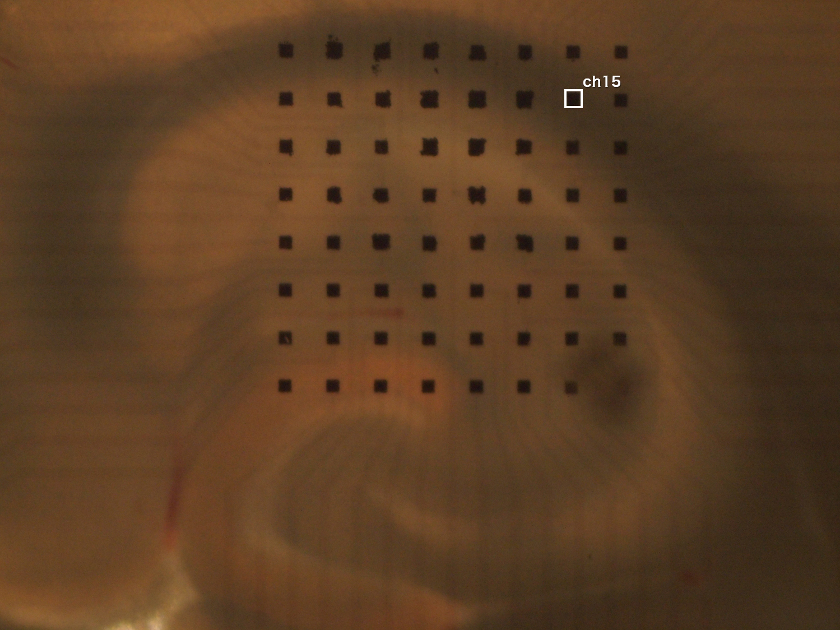
- Transversely sectioned slices were made with the rostral side tilted 12.7º higher than the caudal side to make it easier to generate spontaneous sharp waves. The hippocampal sharp waves are thought to be involved in memory fixation, and are generated in the CA3 region and propagate to the CA1 region. We analyzed the sharp waves generated in the CA3 region, indicated by the red frame.
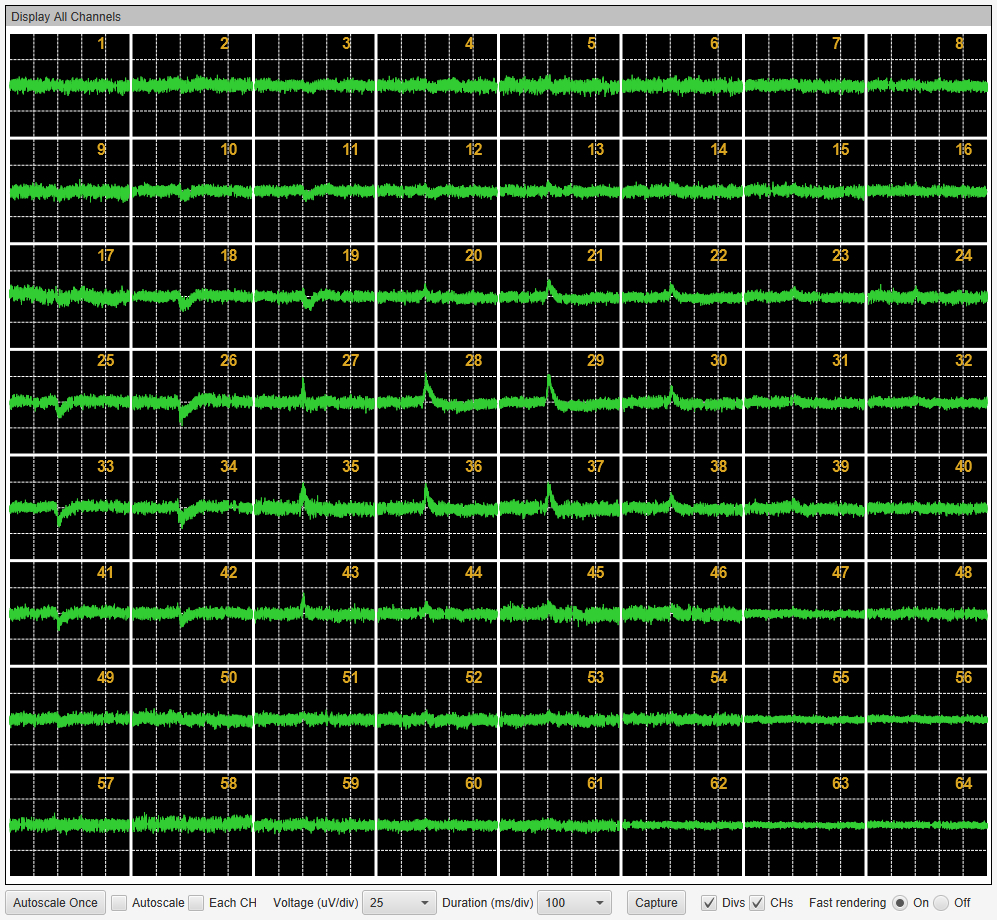
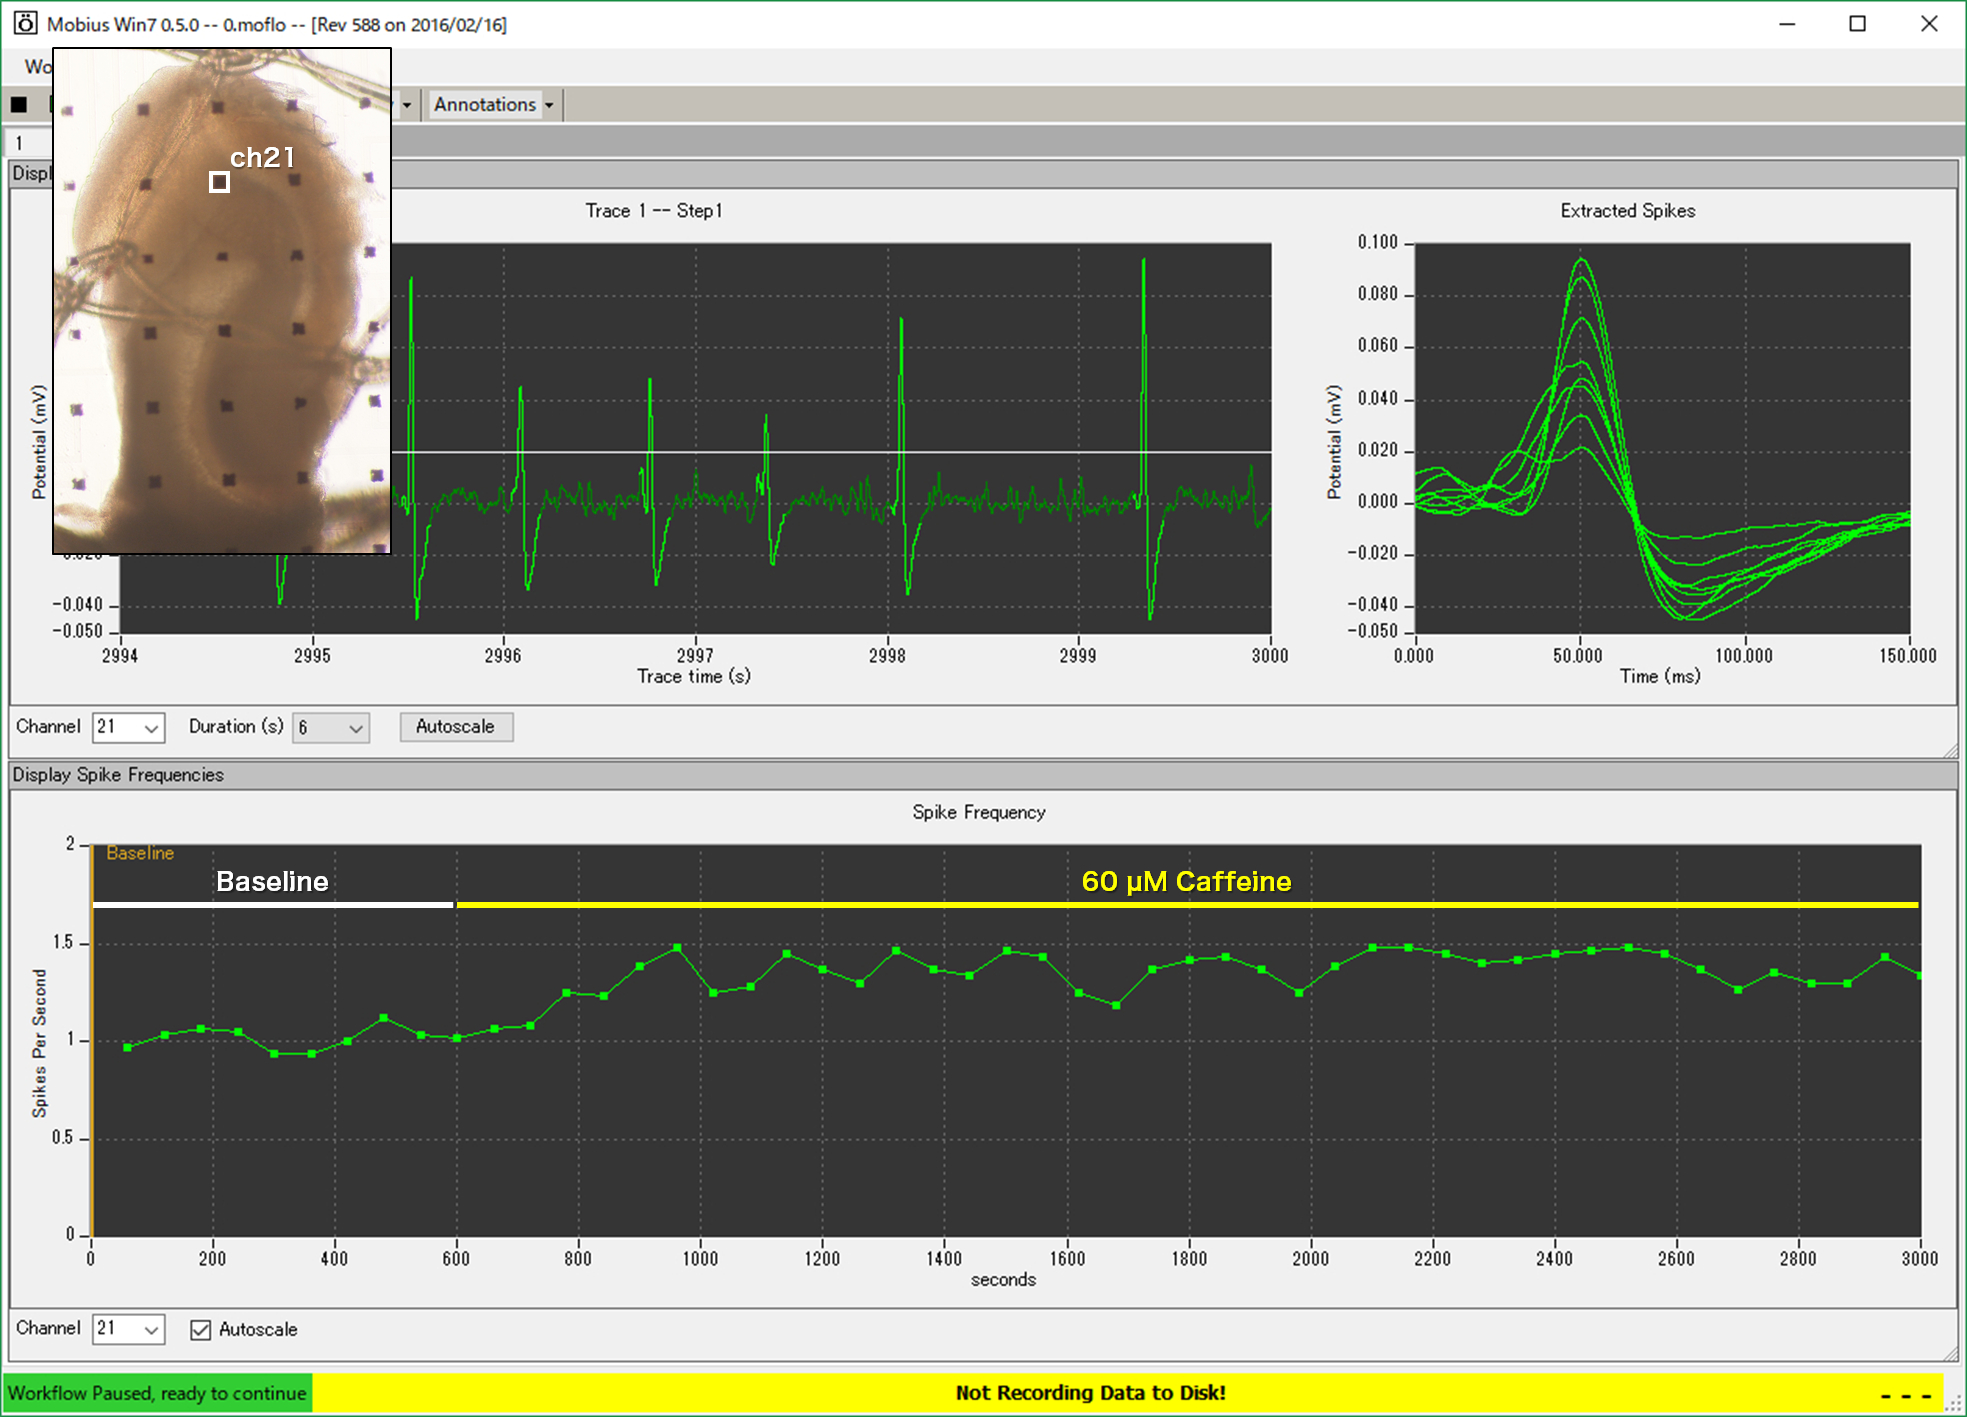
- A 64-channel oscilloscope display at the time of sharp wave generation. The next slide is the analysis result for ch35 shown on this slide.
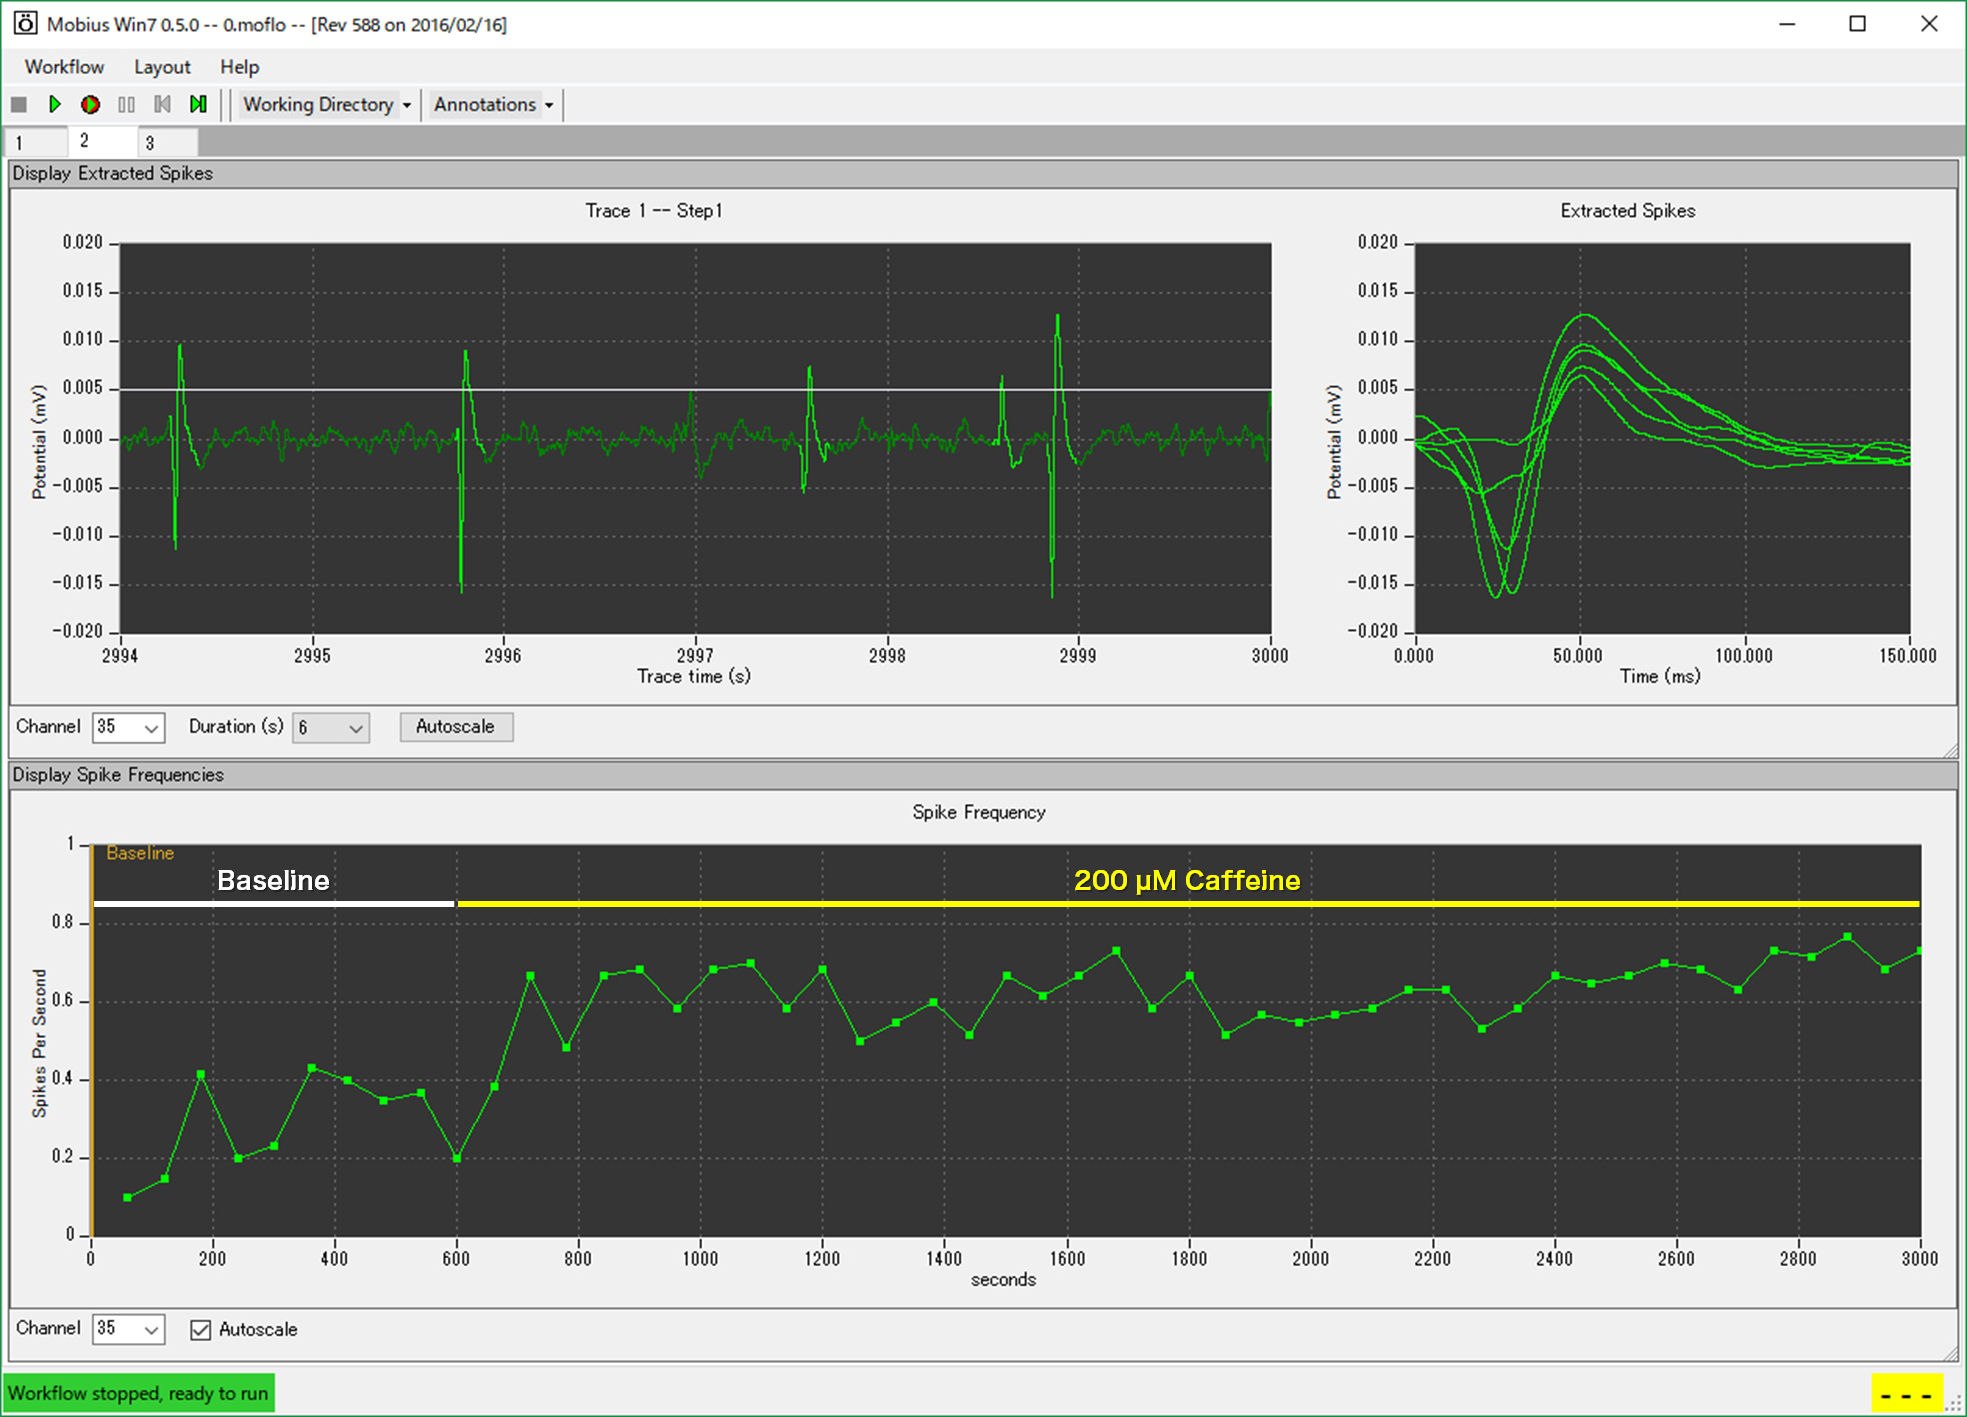
- Data was band-pass filtered at 2–30 Hz, and then what exceeded 5 times the SD of the baseline noise was detected as sharp waves. Administering caffeine, which is a nonselective antagonist of the adenosine receptor, increased the frequency of sharp waves in a dose-dependent way.
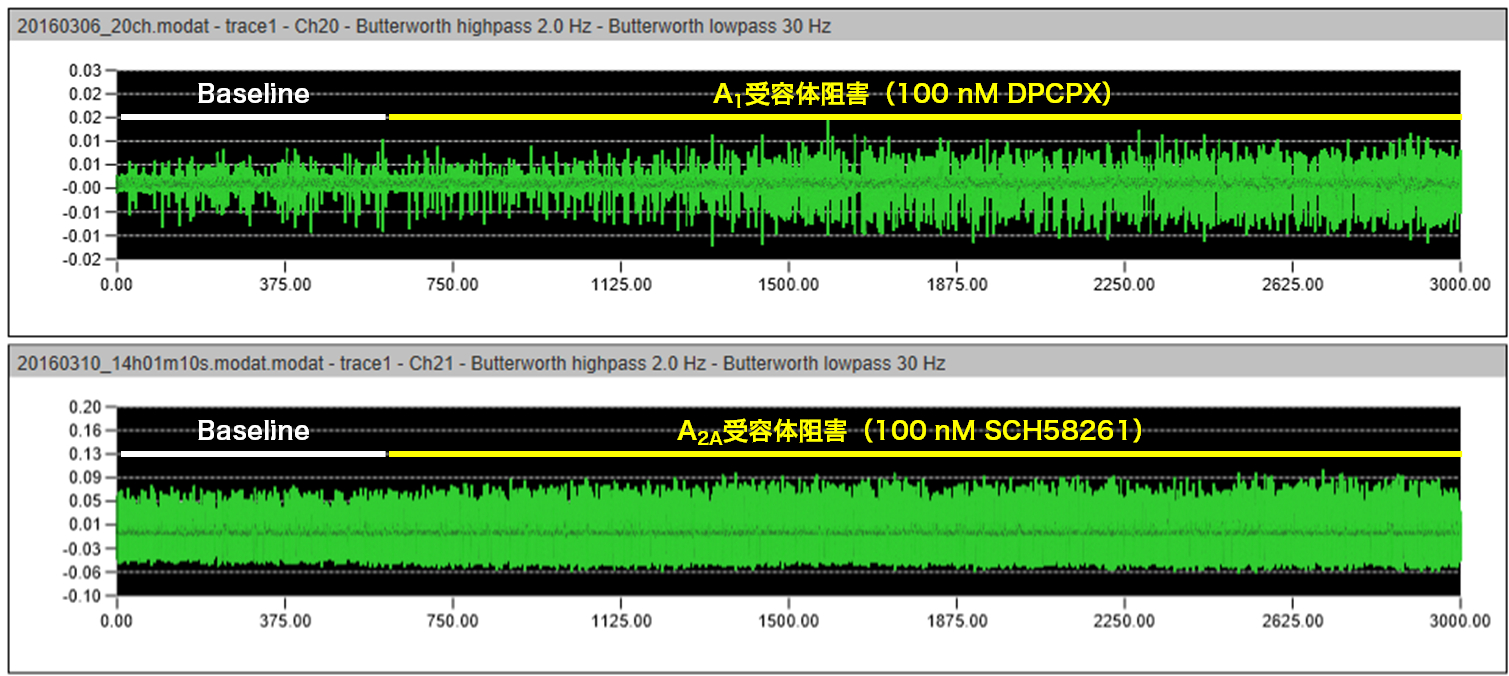
- The adenosine A1 receptor selective antagonist increased the frequency of sharp waves, while the selective agonist reduced it. Adenosine A2A receptor selective antagonists had no effect on the frequency. Furthermore, caffeine antagonized the effect of the adenosine A1 receptor selective agonist on the frequency.
- The caffeine increased sharp waves even in slices containing only the dentate gyrus-CA3 region. These results suggest that the caffeine-induced sharp waves might be caused by antagonism of the adenosine A1 receptor in the CA3 region.
- Data provided by
Yusuke Watanabe, Dr. Yuji Ikegaya
Laboratory of Chemical Pharmacology, Graduate School of Pharmaceutical Sciences, The University of Tokyo
- A mouse hippocampal slice on a MED probe (MED-P515A). Data obtained from an electrode located in the border region between the cortex and the hippocampus (hippocampal white plate) was chosen to analyze epilepsy-like oscillation induced by drug perfusion.
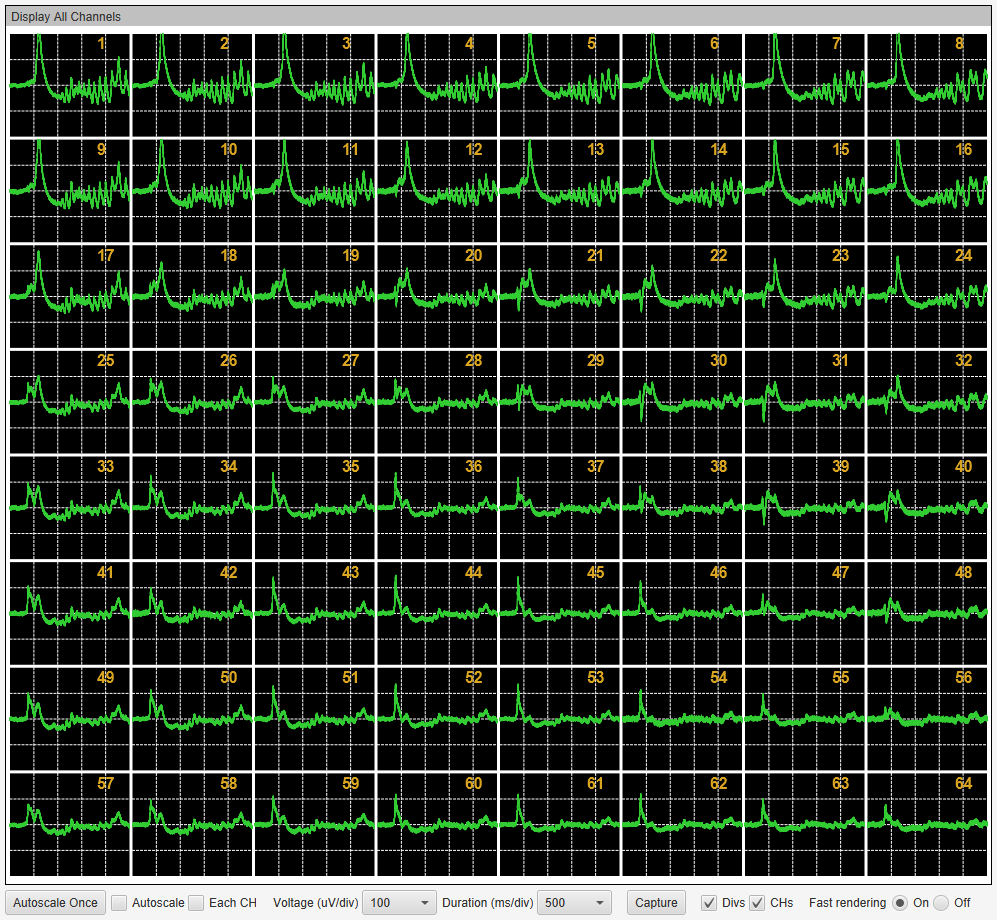
- After applying 14 test compounds as epileptogenic-positive or -negative agents in five incremental doses, data was recorded for 10 minutes for each dose. The screenshot on the left shows a 64-channel oscilloscope window of epilepsy-like waveforms induced by picrotoxin.
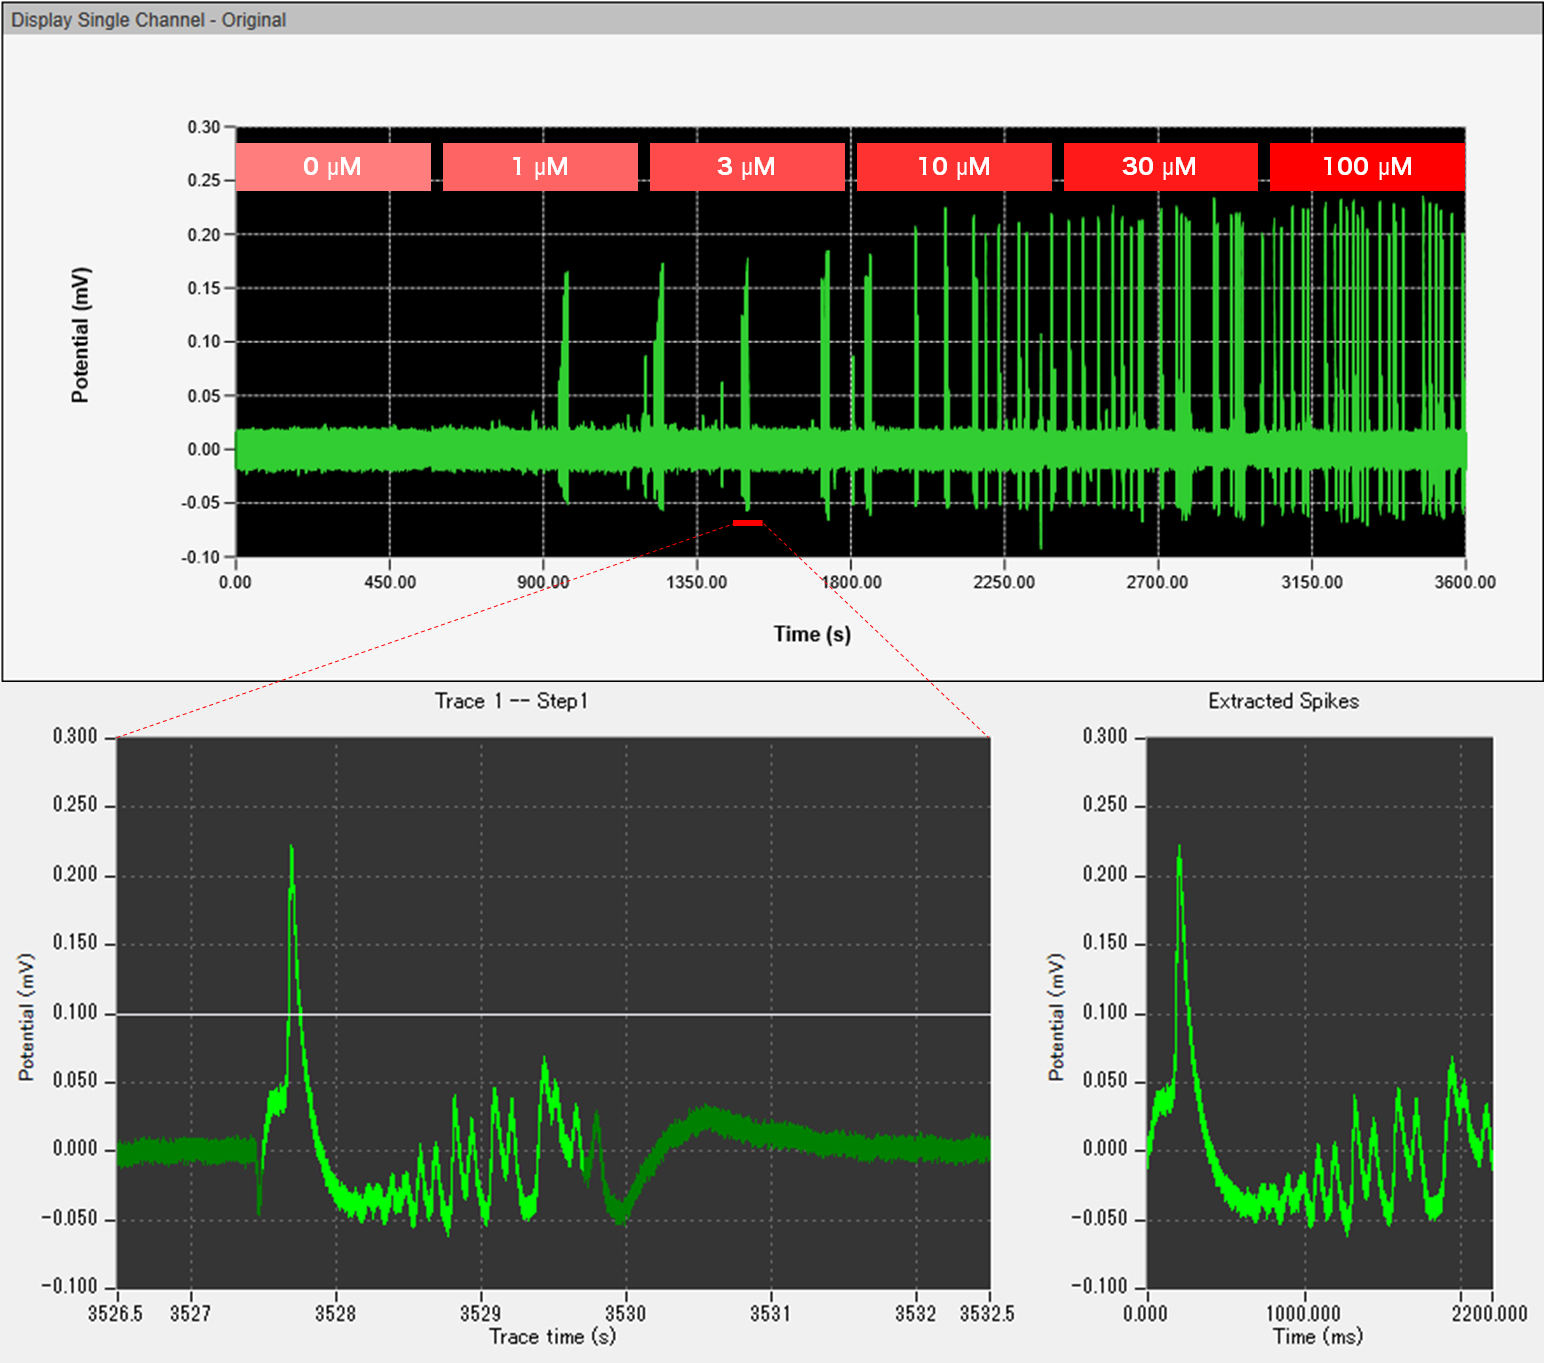
- Data from 2 to 9 minutes in the 10-minute period was analyzed. The ranges every 50 ms were differentiated to detect peaks where the slope exceeded 0.1 µV/ms. The range of −200 to 2,070 ms was extracted as epilepsy-like waveforms based on the peak time.
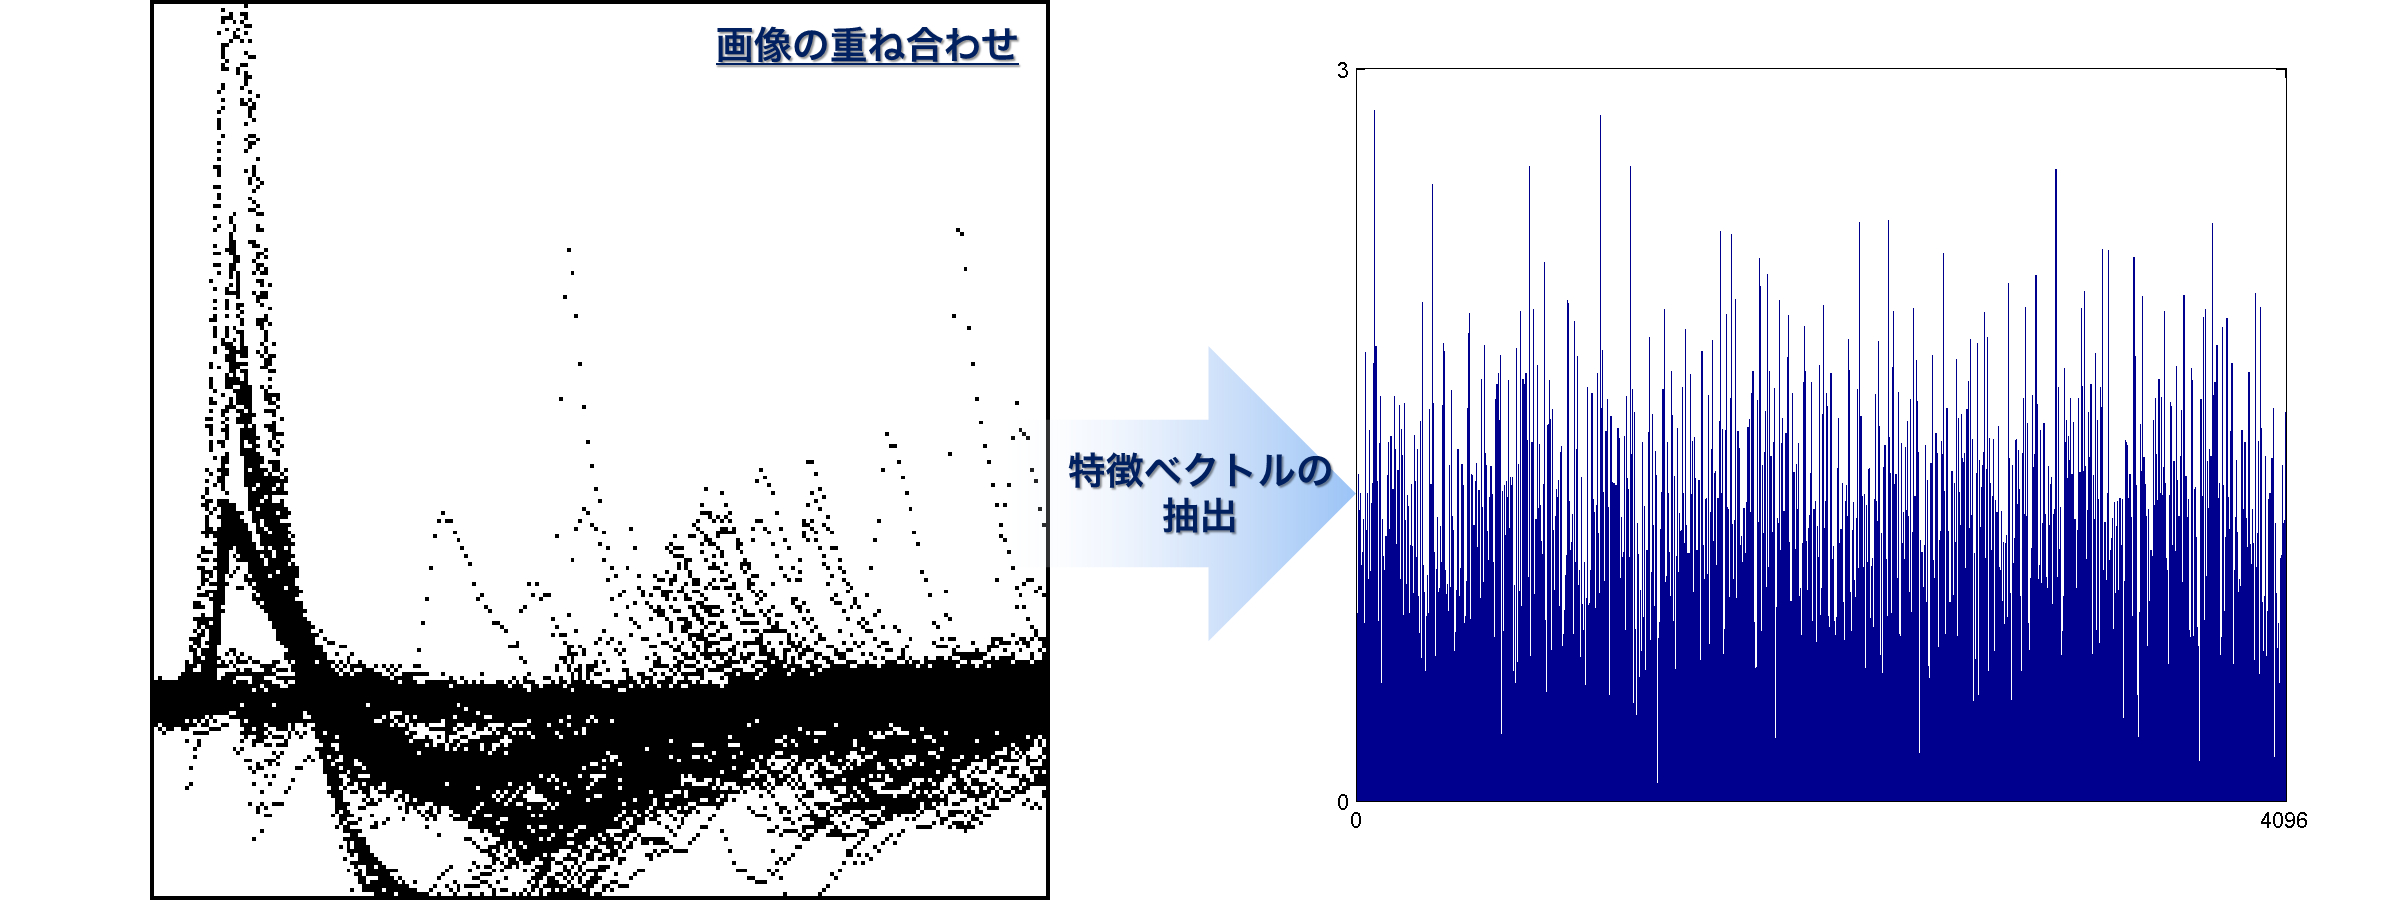
- Epilepsy-like waveforms were converted into 227 × 227-pixel (1 µV/px × 0.01 s/px) images. All images were superimposed as a single image for each dose. Caffe, an open-source framework for deep learning, was used to extract 4,096 dimensions of feature vectors from the superimposed images, and used them as input features in a PCA-based linear SVM.
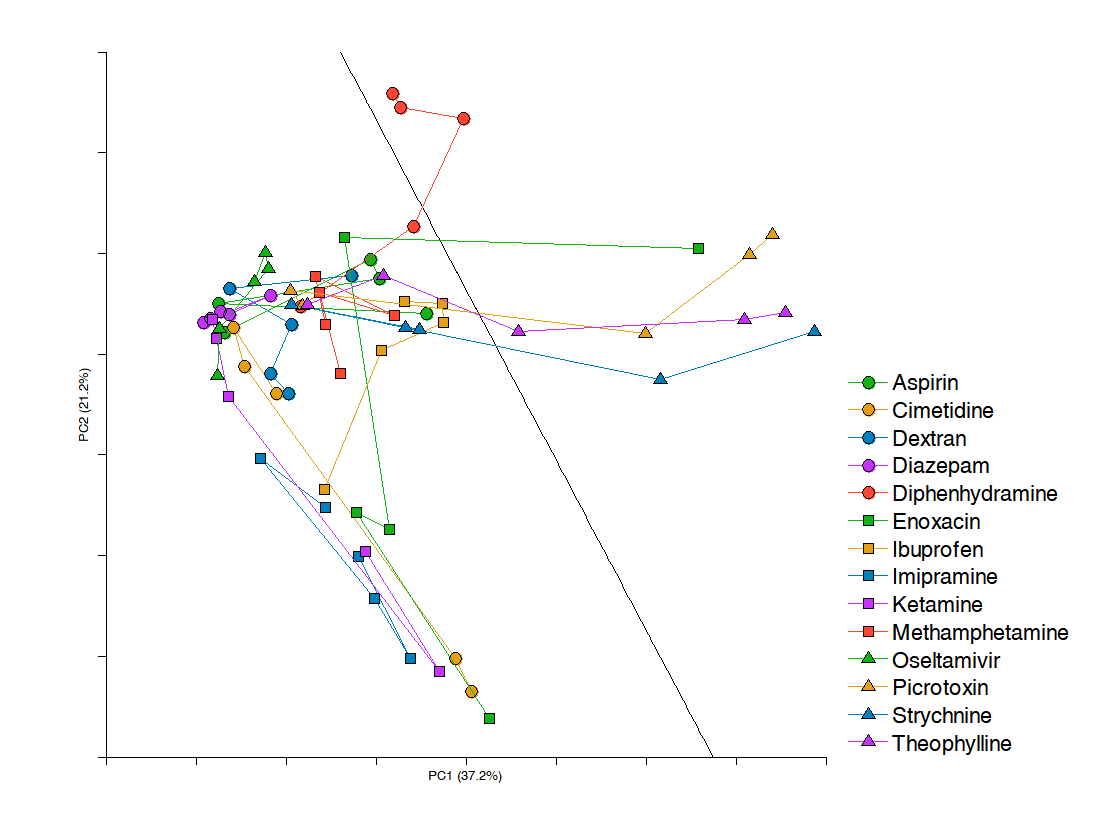
- The 4,096-dimensional feature vectors were dimensionally reduced by principal component analysis and plotted in the space of first and second principal components. Each dose of each drug was plotted as a single data point, and the data points for each identical drug were connected by a straight line. Drugs and doses showing epileptogenic effects were classified into the space on the right side of the boundary determined by SVM. In addition, the boundary could also classify well established but untested compounds with accuracy.
- Data provided by
Mengxuan Gao, Dr. Yuji Ikegaya
Laboratory of Chemical Pharmacology, Graduate School of Pharmaceutical Sciences, The University of Tokyo
Dissociated Neural Culture
When seeding a neural suspension onto the recording electrodes of a MED probe and then culturing them over several days, the neurons will voluntarily connect to each other to form networks and display spontaneous activities even in the absence of external input. The patterns of spontaneous activities, such as tonic or burst firings, differ according to their origin, namely their location in the brain, and from one electrode to another. Those frequencies, durations, or temporal patterns, etc. will vary depending on the culturing period. This process might be regarded as reproduction of a neural network during the fetal developmental period on the in-vitro MEA. In recent years, this neural network on MEA has been used to develop novel in-vitro assays to test the efficacy or safety of drugs.
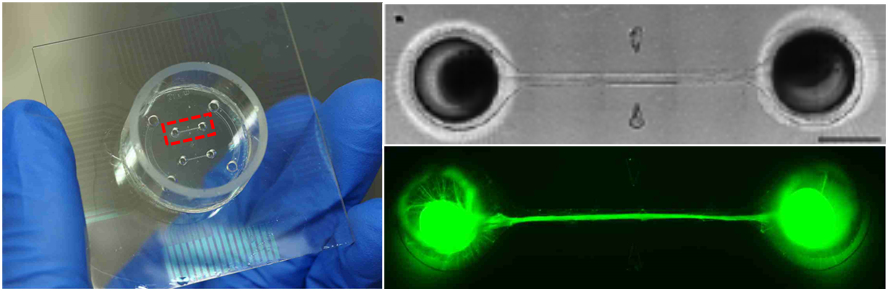
- This microfluidic device was mounted on a MED probe with 16 electrodes (4 × 4 array) placed in four areas separated by a short distance. Cerebral organoids were cultured on each electrode area to promote mutual innervation through microfluidic channels, creating connected organoids. This organoid technology has successfully modeled signal transmission between physically distant brain regions.
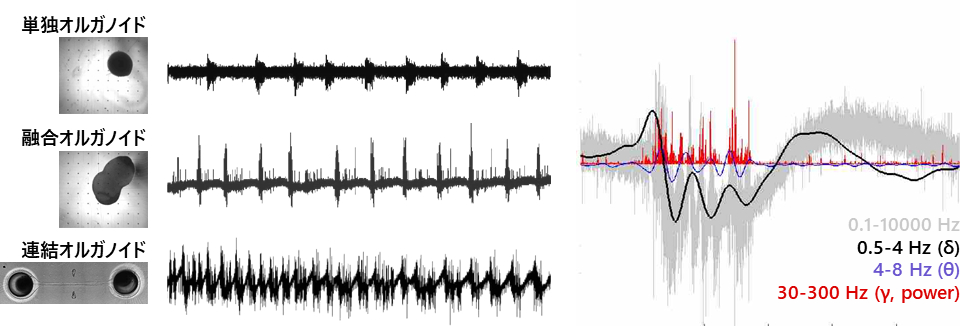
- Connected organoids displayed more complex and vigorous neural activity than either single organoids or fused organoids with the same number of cells. These results show that signaling through axonal bundles, which functionally connect physically distant organoids, is important in forming activity patterns. Furthermore, a low-band activity component called oscillation, which is similar to EEGs of premature babies, was observed in this activity relatively earlier (9 weeks) than in single organoids.
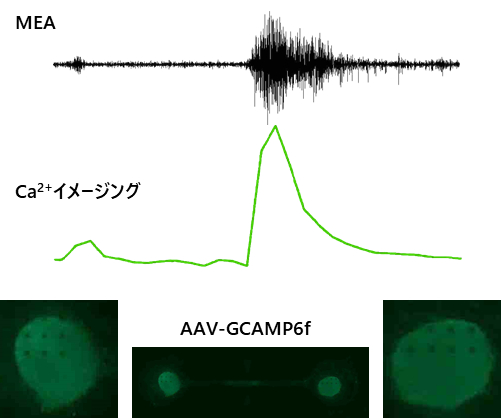
- Simultaneous measurement of Ca2+ imaging and MEA. The Ca2+ transient (transient increase in intracellular Ca2+) co-occurred with the electrical burst activity acquired by MEA in a synchronized burst.
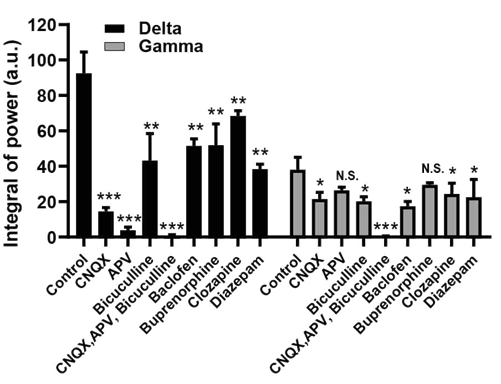
- We quantitatively evaluated neural activities of connected organoids by the number of spike detections, the frequency of synchronized bursts, and power in the delta (0.5–4 Hz) and gamma (30–300 Hz) bands by a wavelet transform, etc. These indices were consistently affected by various ligand treatments for glutamate and GABA receptors, indicating the possibility of using connected organoids for drug evaluation.
- Data provided by
Dr. Tatsuya Osaki and Dr. Yoshiho Ikeuchi
the Institute of Industrial Science, University of Tokyo
Dissociated Cardiac Culture
Monolayer-sheet-like culture preparations of cardiomyocytes show characteristic extracellular potential waveforms in each beat. The duration between two peaks in the waveform, defined as the 1st and 2nd peaks, is called the FPD (Field Potential Duration), and it is thought to correspond to APD (Action Potential Duration) in intracellular recordings. Drug-induced prolongation of FPD is regarded as a surrogate marker for predicting the proarrhythmic effects of drugs in clinical situations, and FPD evaluation assays have frequently been conducted using human iPS cell-derived cardiomyocytes.
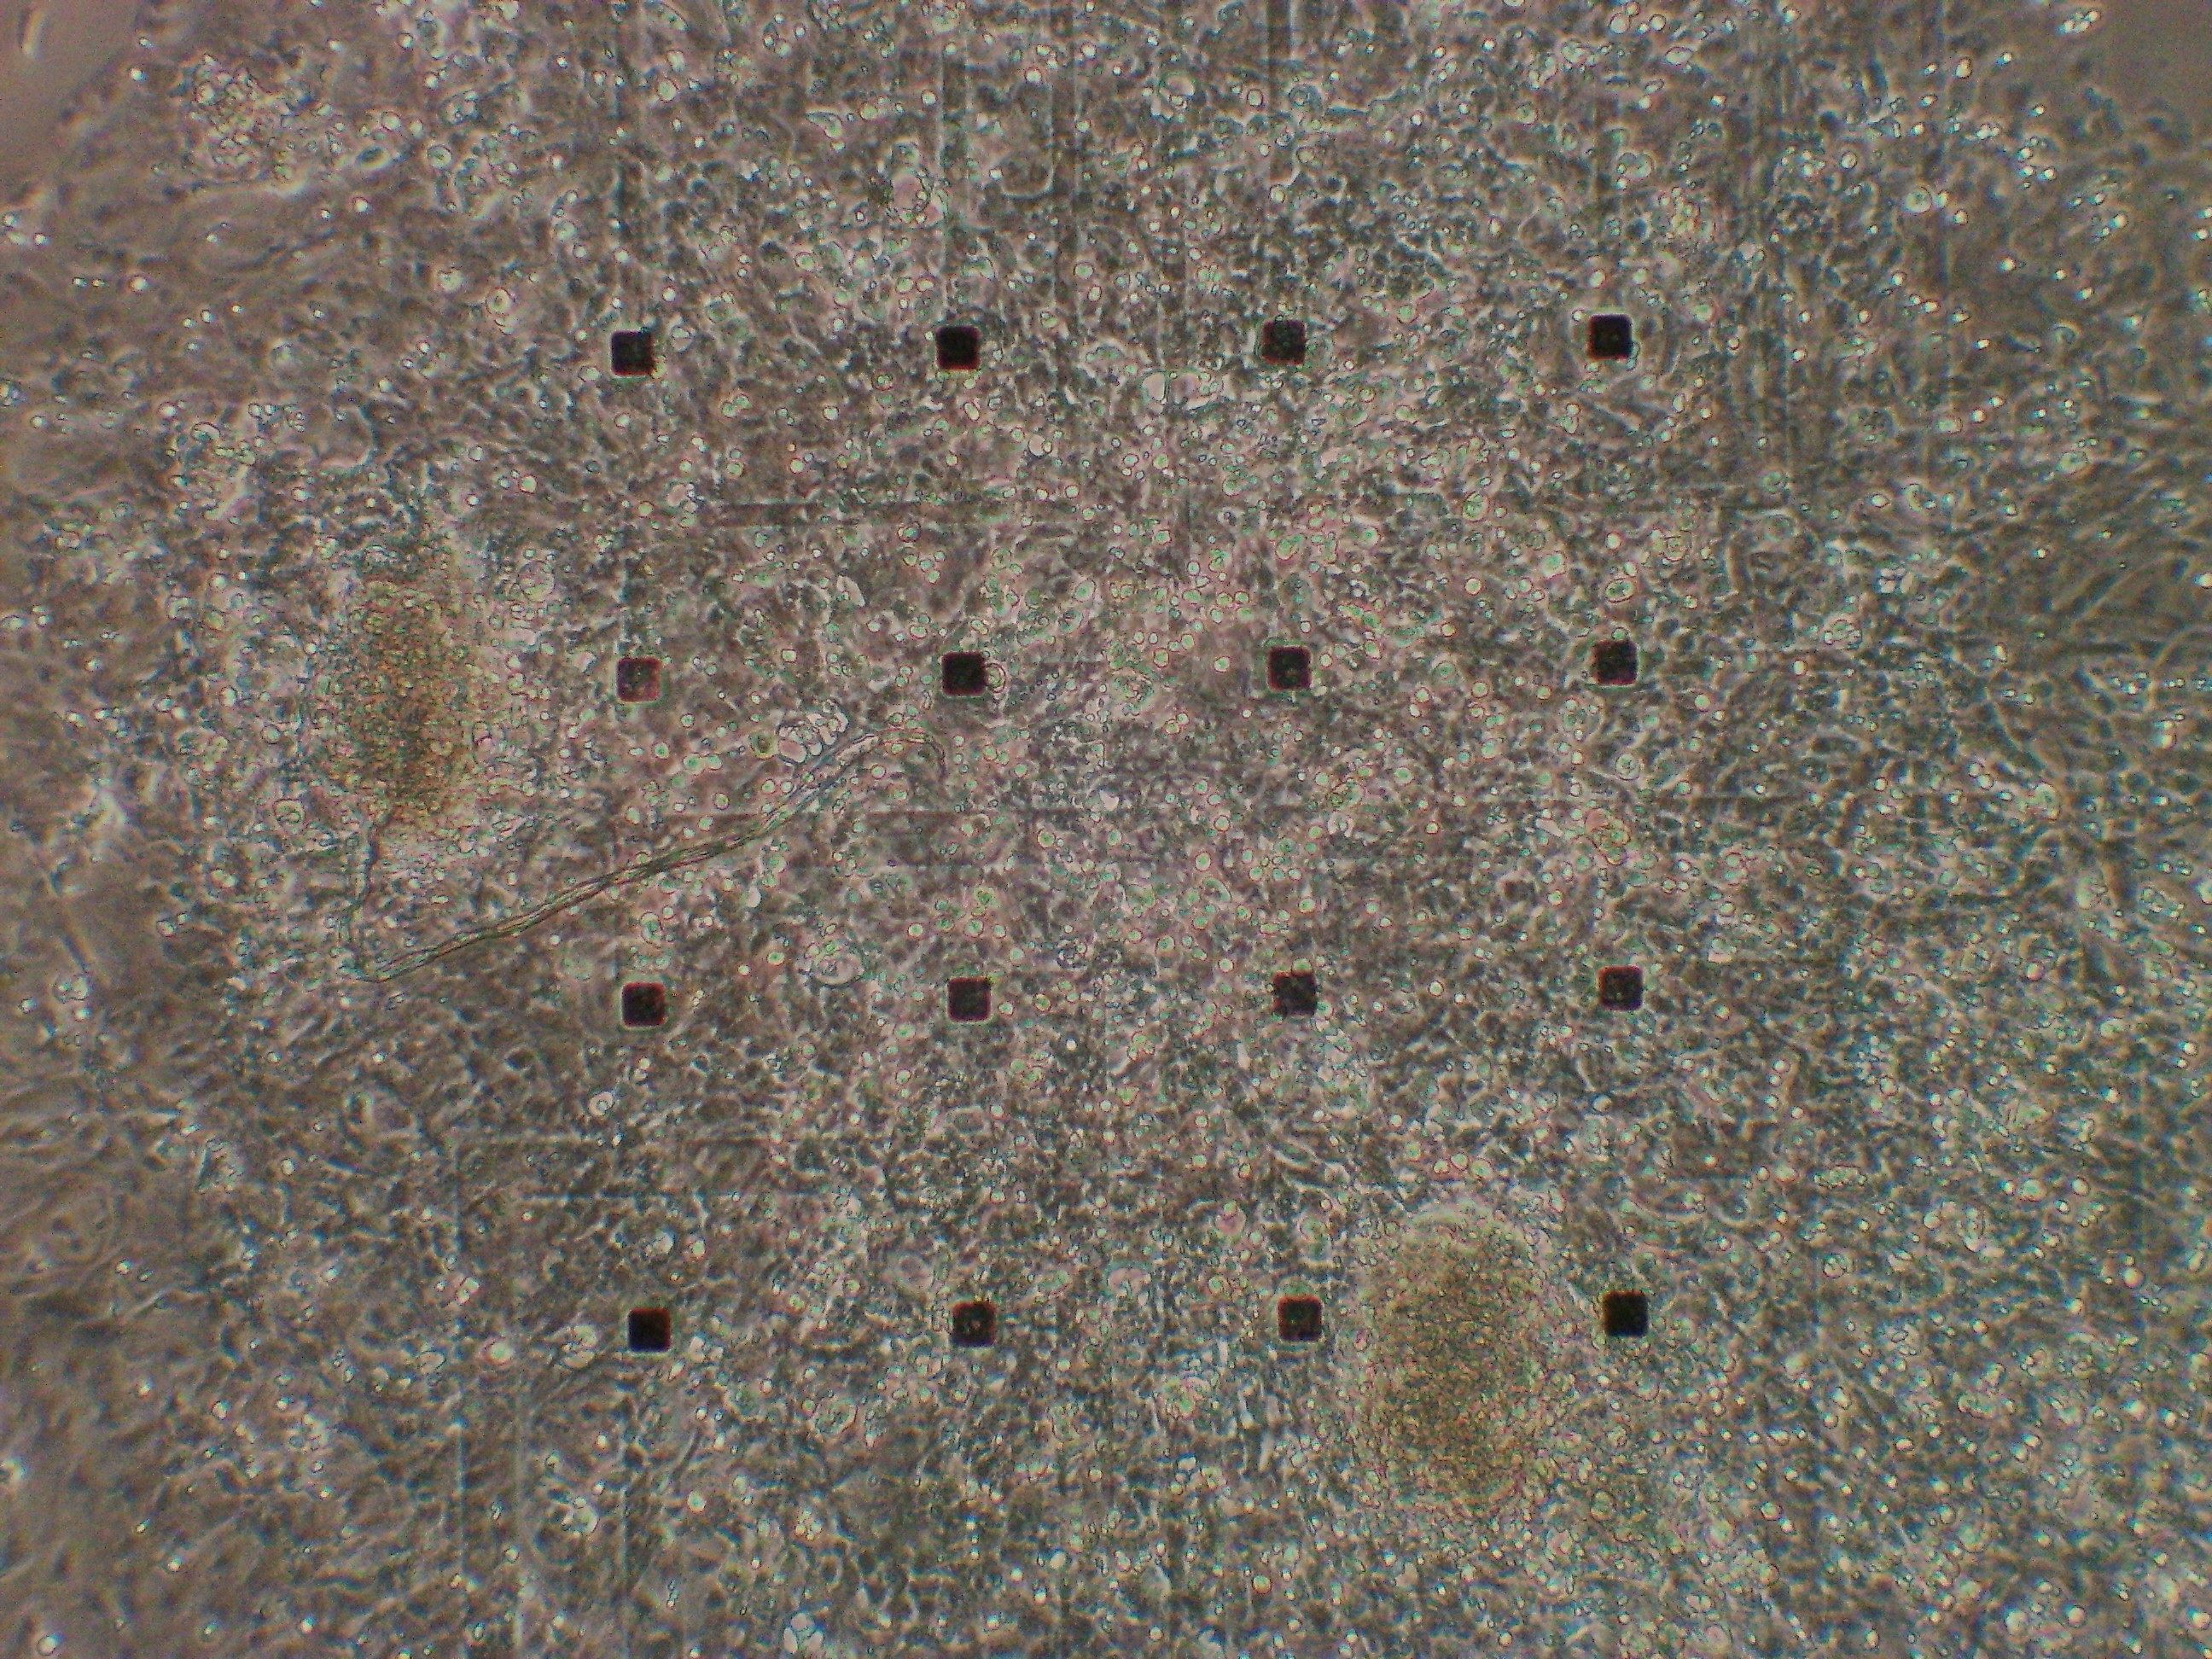
- A monolayer sheet-like culture of human iPS cell-derived cardiomyocytes cultured in one well of a MED plate (MED-Q2430L). Seeded at 30,000 cells/2 µL by following the protocol widely used for MED probes.
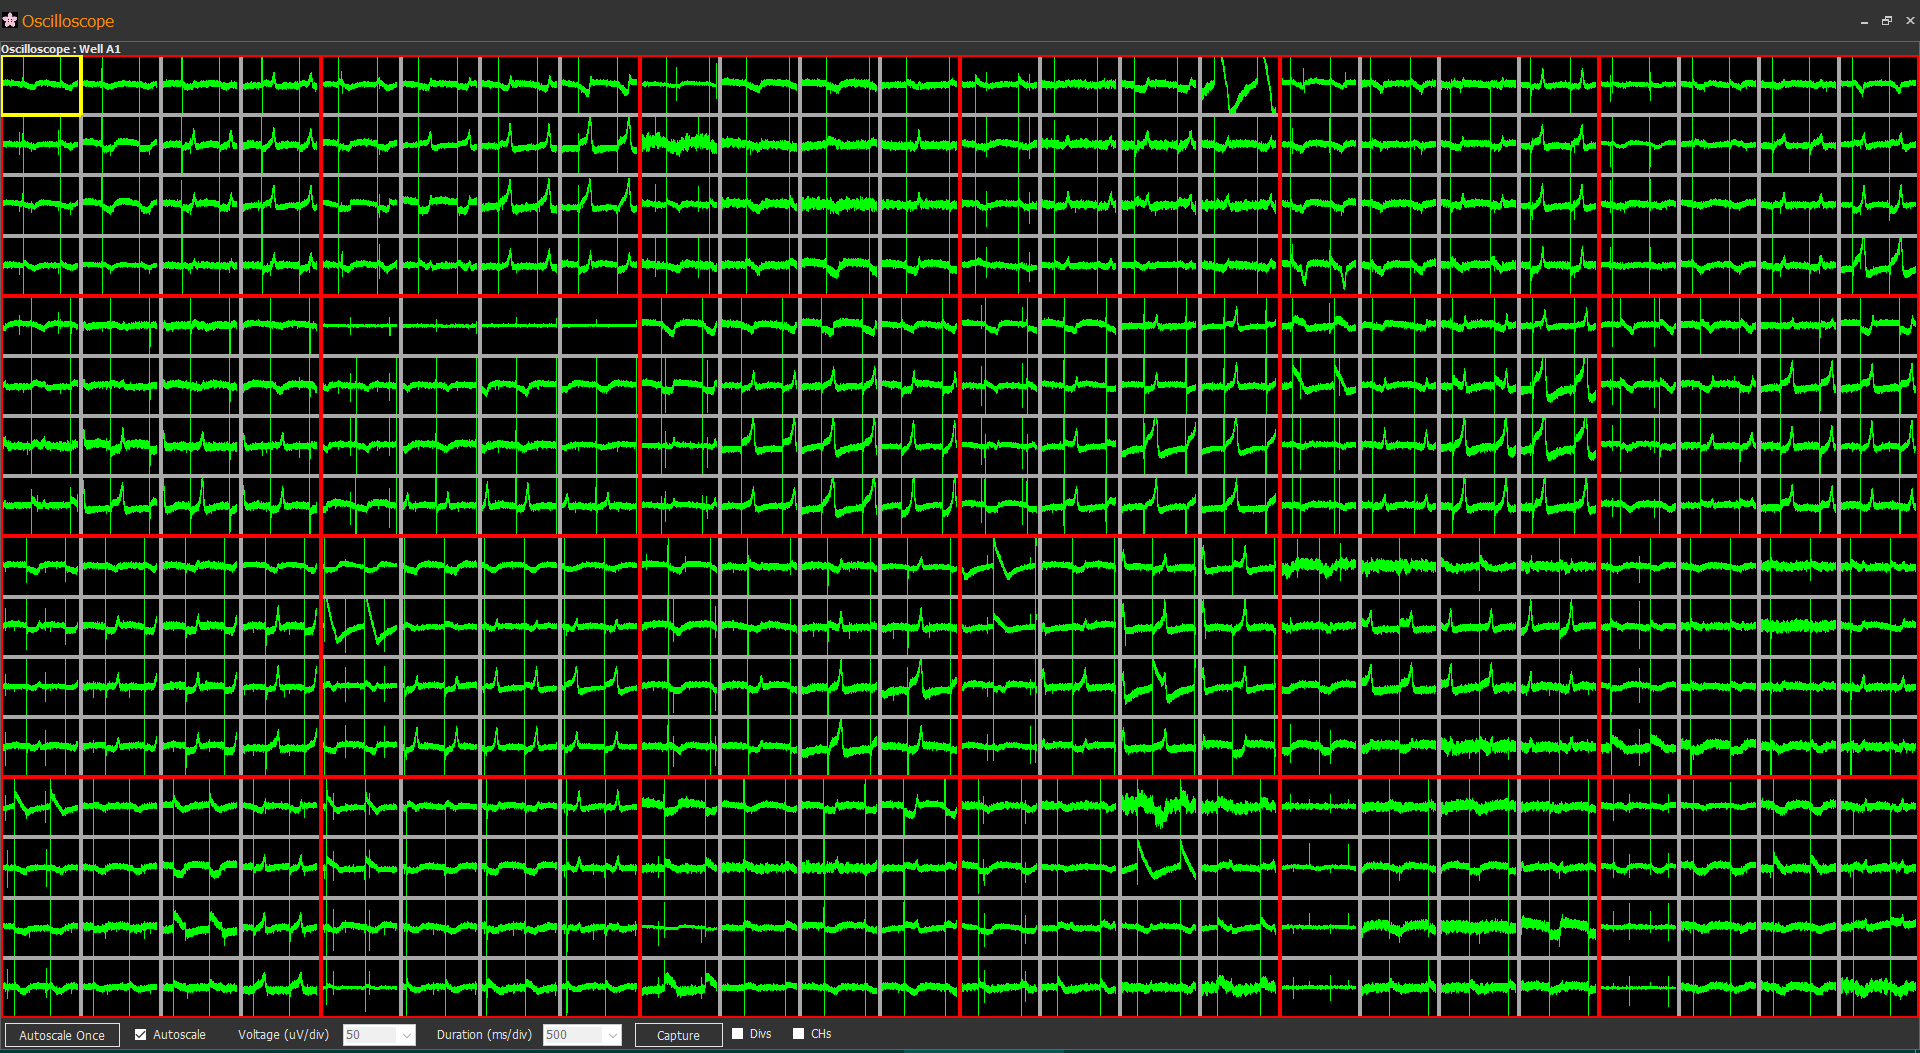
- A 384-channel oscilloscope display with MED64 Symphony, the software dedicated to MED64-Presto. The quality of data is same as that of MED64-Basic, but the throughput is six times greater.
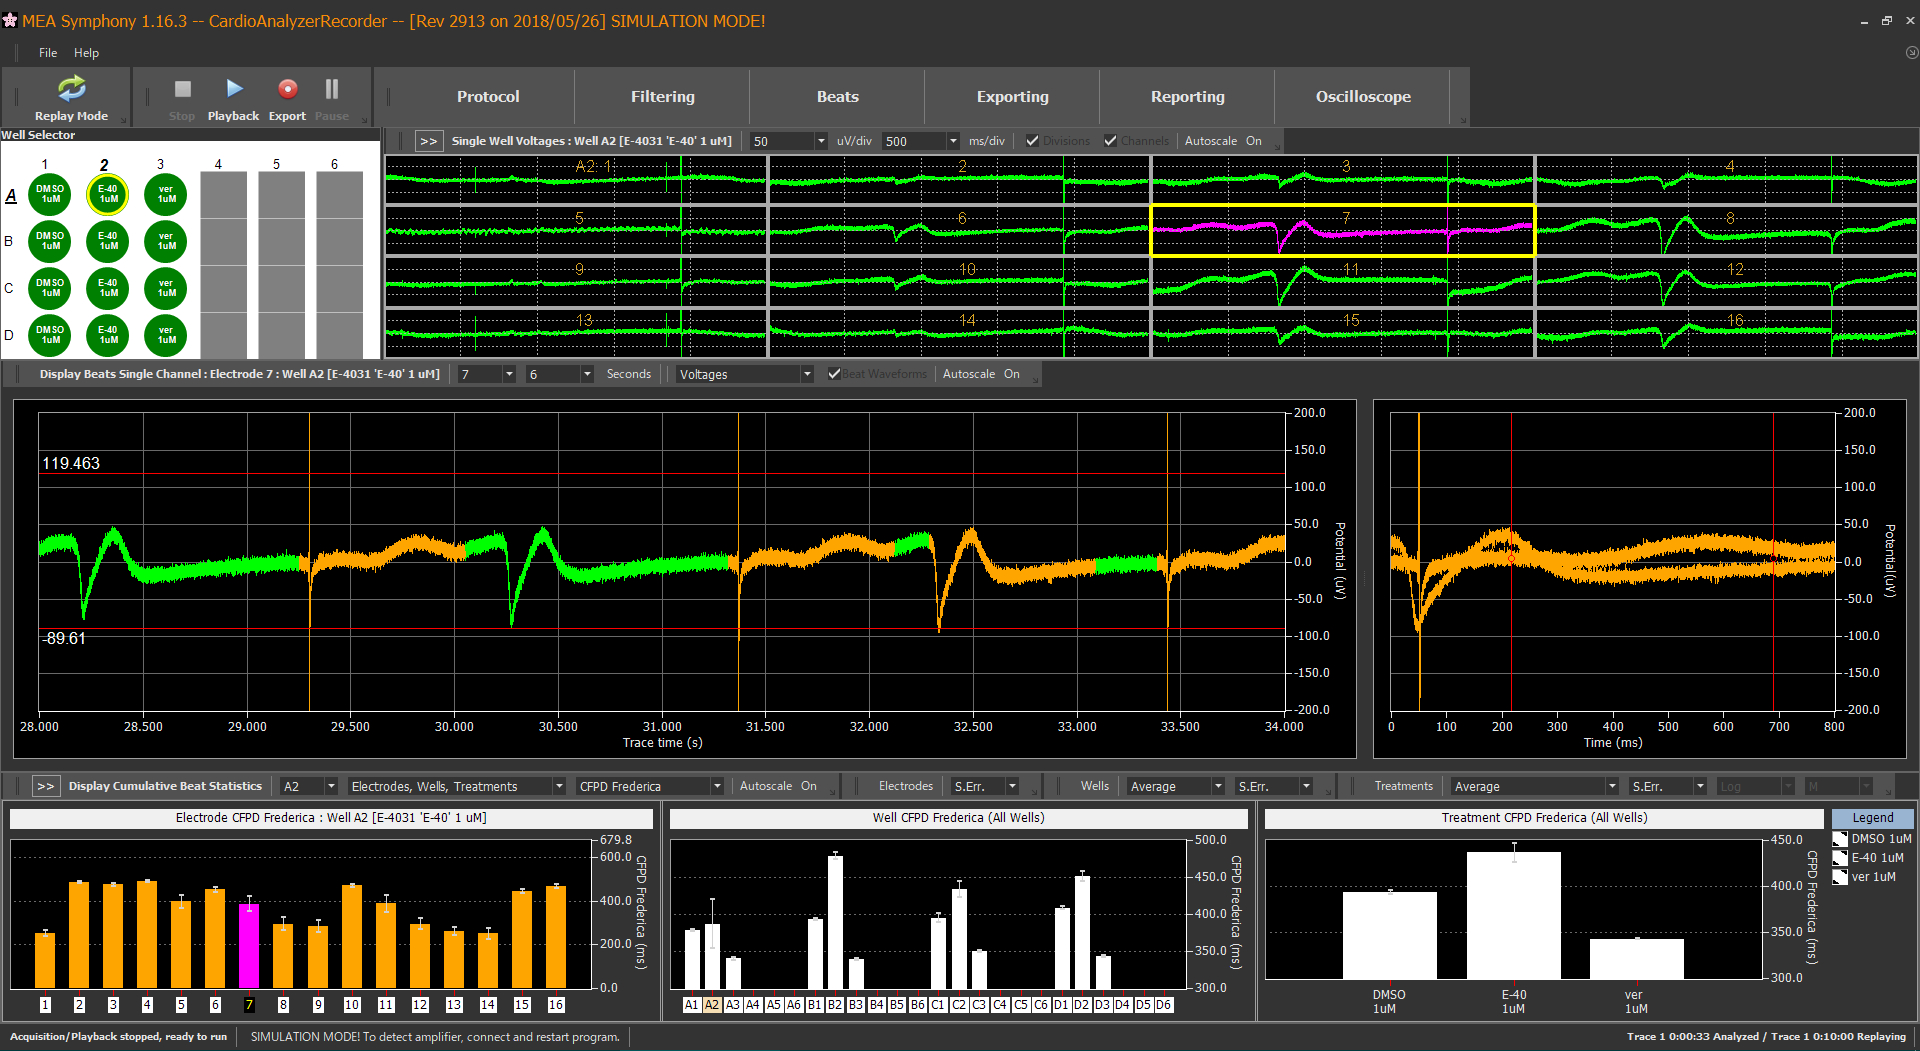
- A main window in MED64 Symphony. The raw waveform charts for selected wells are on the top, and the raw waveform chart and the detected FP waveform at the selected electrode are in the middle. At the bottom-left are bar charts of selected measurements (beat average of corrected FPD in this slide) for each electrode in the selected wells; at the bottom-center are representative values (the values in an arbitrary selected electrode in this slide) for each well, and at the bottom-right are representative values for each well (test compound) group. Compared to the DMSO control group, the corrected FPD is prolonged in the E-4031 group and shortened in the verapamil group. The graphs or charts shown in each row, such as BPM or amplitude and so on, can be selected from the menu.
- Data provided by
Hiroki Ohnaka, Daisuke Saji
Shiga Laboratory, Nisseibilis Co., Ltd.
Gastrointestinal (GI) Tract
Isolate and cut out tissue, including stomach and small intestine tissue, and remove the mucous membrane to make a preparation that includes the muscular layer and serosal membrane only. By recording under 0.1 high-pass filtering at up to 34ºC, activities with different characteristics can be observed in different parts of the GI tract. The waveform includes a component that also occurs under pharmacological blockade of Ca channels, and it is thought to be a pacemaker potential generated by Cajal interneurons.

- Isolated mouse ileal muscle tissue on a MED probe (MED-P515A). The dialysis membrane (fractional molecular weight: 12,000) and muscle-layer tissue are interwoven into the wire of the slice anchor and pressed onto the electrodes (dialysis membrane method) to improve the data acquisition efficiency and increase the acquired amplitude.
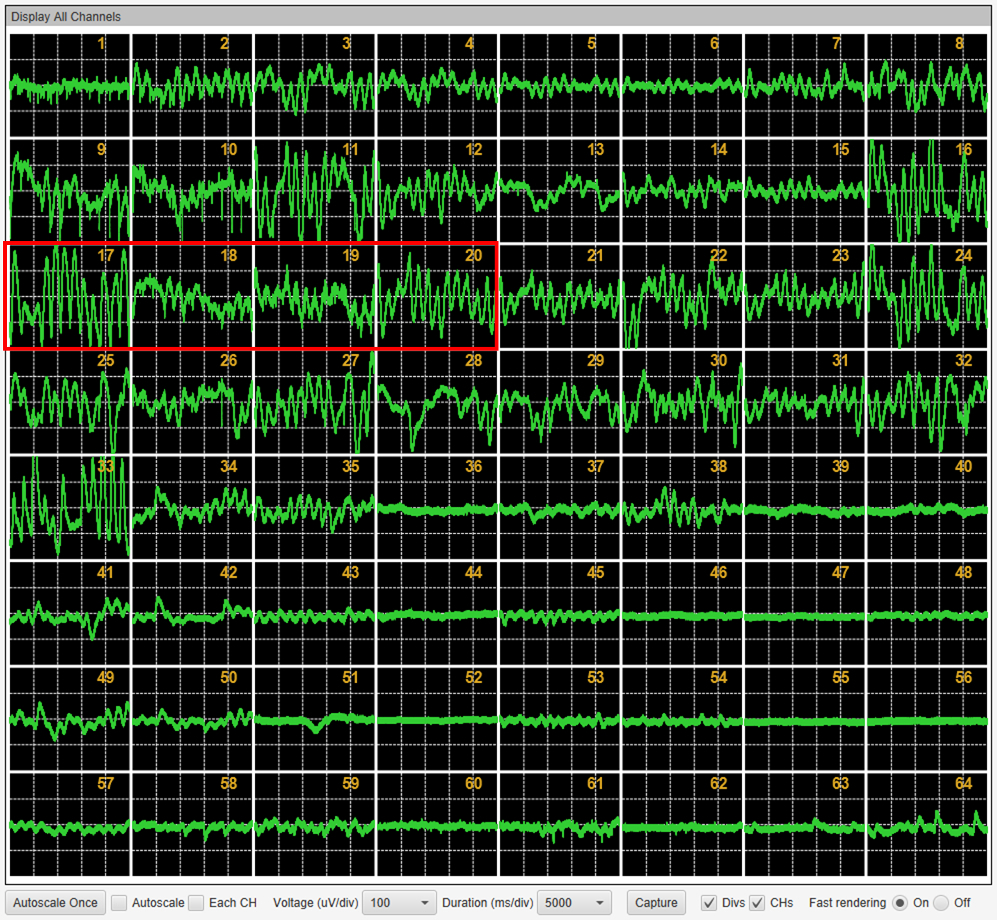
- A 64-channel oscilloscope display of ileal extracellular potentials (0.1–10,000 Hz).
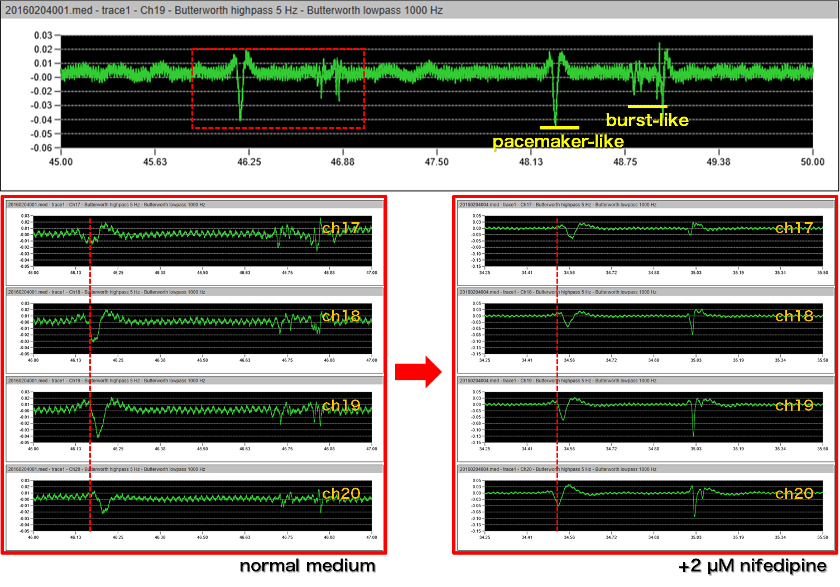
- Enlarged view of ch17-20, indicated by the red frame in the previous figure, showing characteristic fluctuation and burst-like potentials in the ileum after 5–1,000-Hz bandpass filtering. Nifedipine, a dihydropyridine calcium antagonist, suppressed burst-like potentials, but had no effect on fluctuation-like potentials. The former might be calcium spikes derived from smooth muscle cells, and the latter could be pacemaker-like potentials derived from Cajal interneurons.
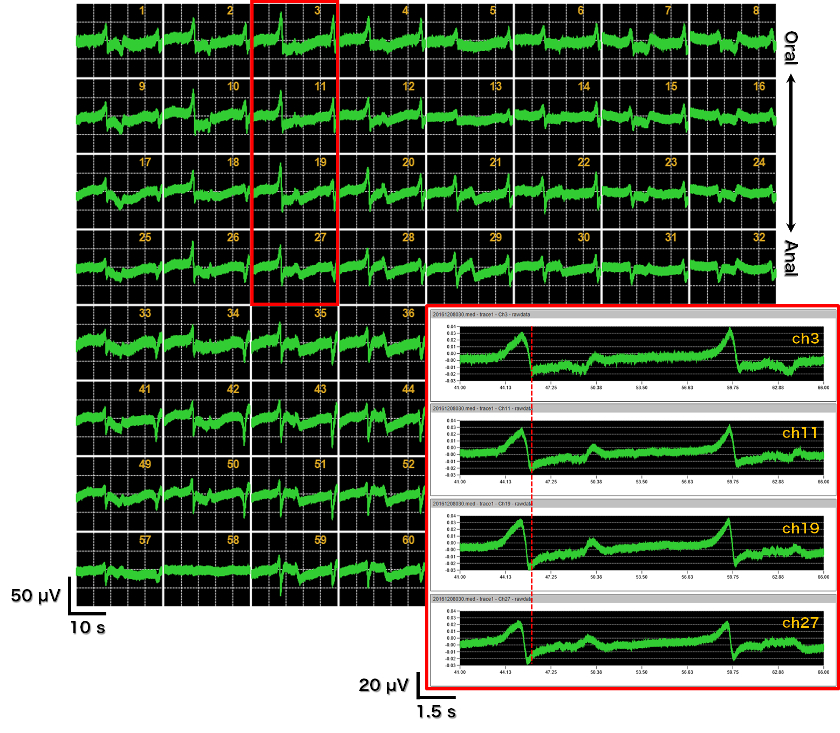
- A 64-channel oscilloscope display of gastric extracellular potentials (0.1–10,000 Hz).
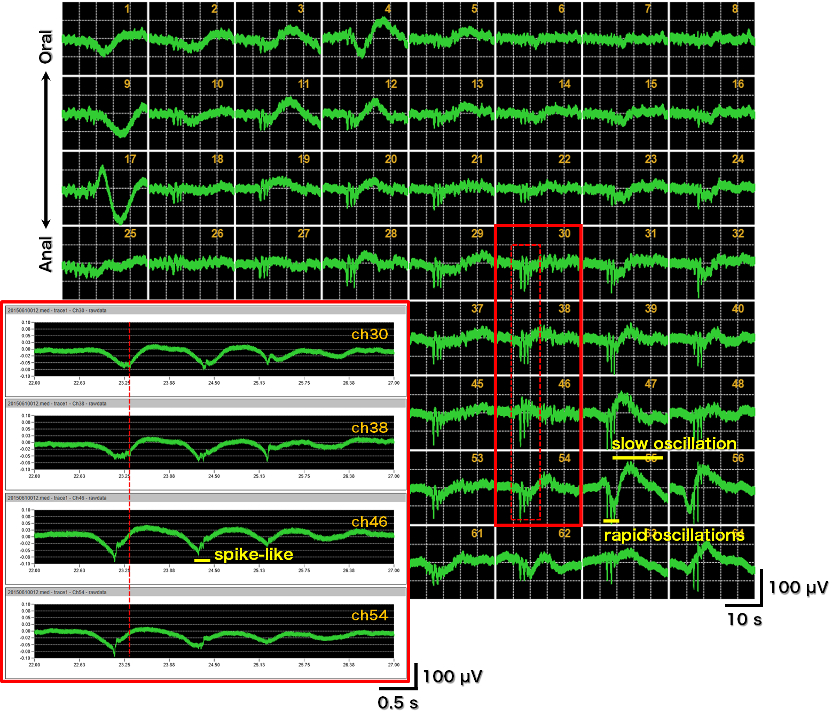
- A 64-channel oscilloscope display of colonic extracellular potentials (0.1–10,000 Hz). It shows a characteristic waveform consisting of three components: a slow fluctuation lasting several seconds, a fast fluctuation occurring with a cycle of 1–2 Hz, and a spike-like potential. By using the dialysis membrane method, all three components could be recorded successfully for the first time. Further analyzing the pattern of potential generation and comparison with pathological models may lead to establishing a novel evaluation assay for the GI tract in the future.
- Data provided by
Dr. Shinsuke Nakayama
Department of Cell Physiology,
Nagoya University Graduate School of Medicine